
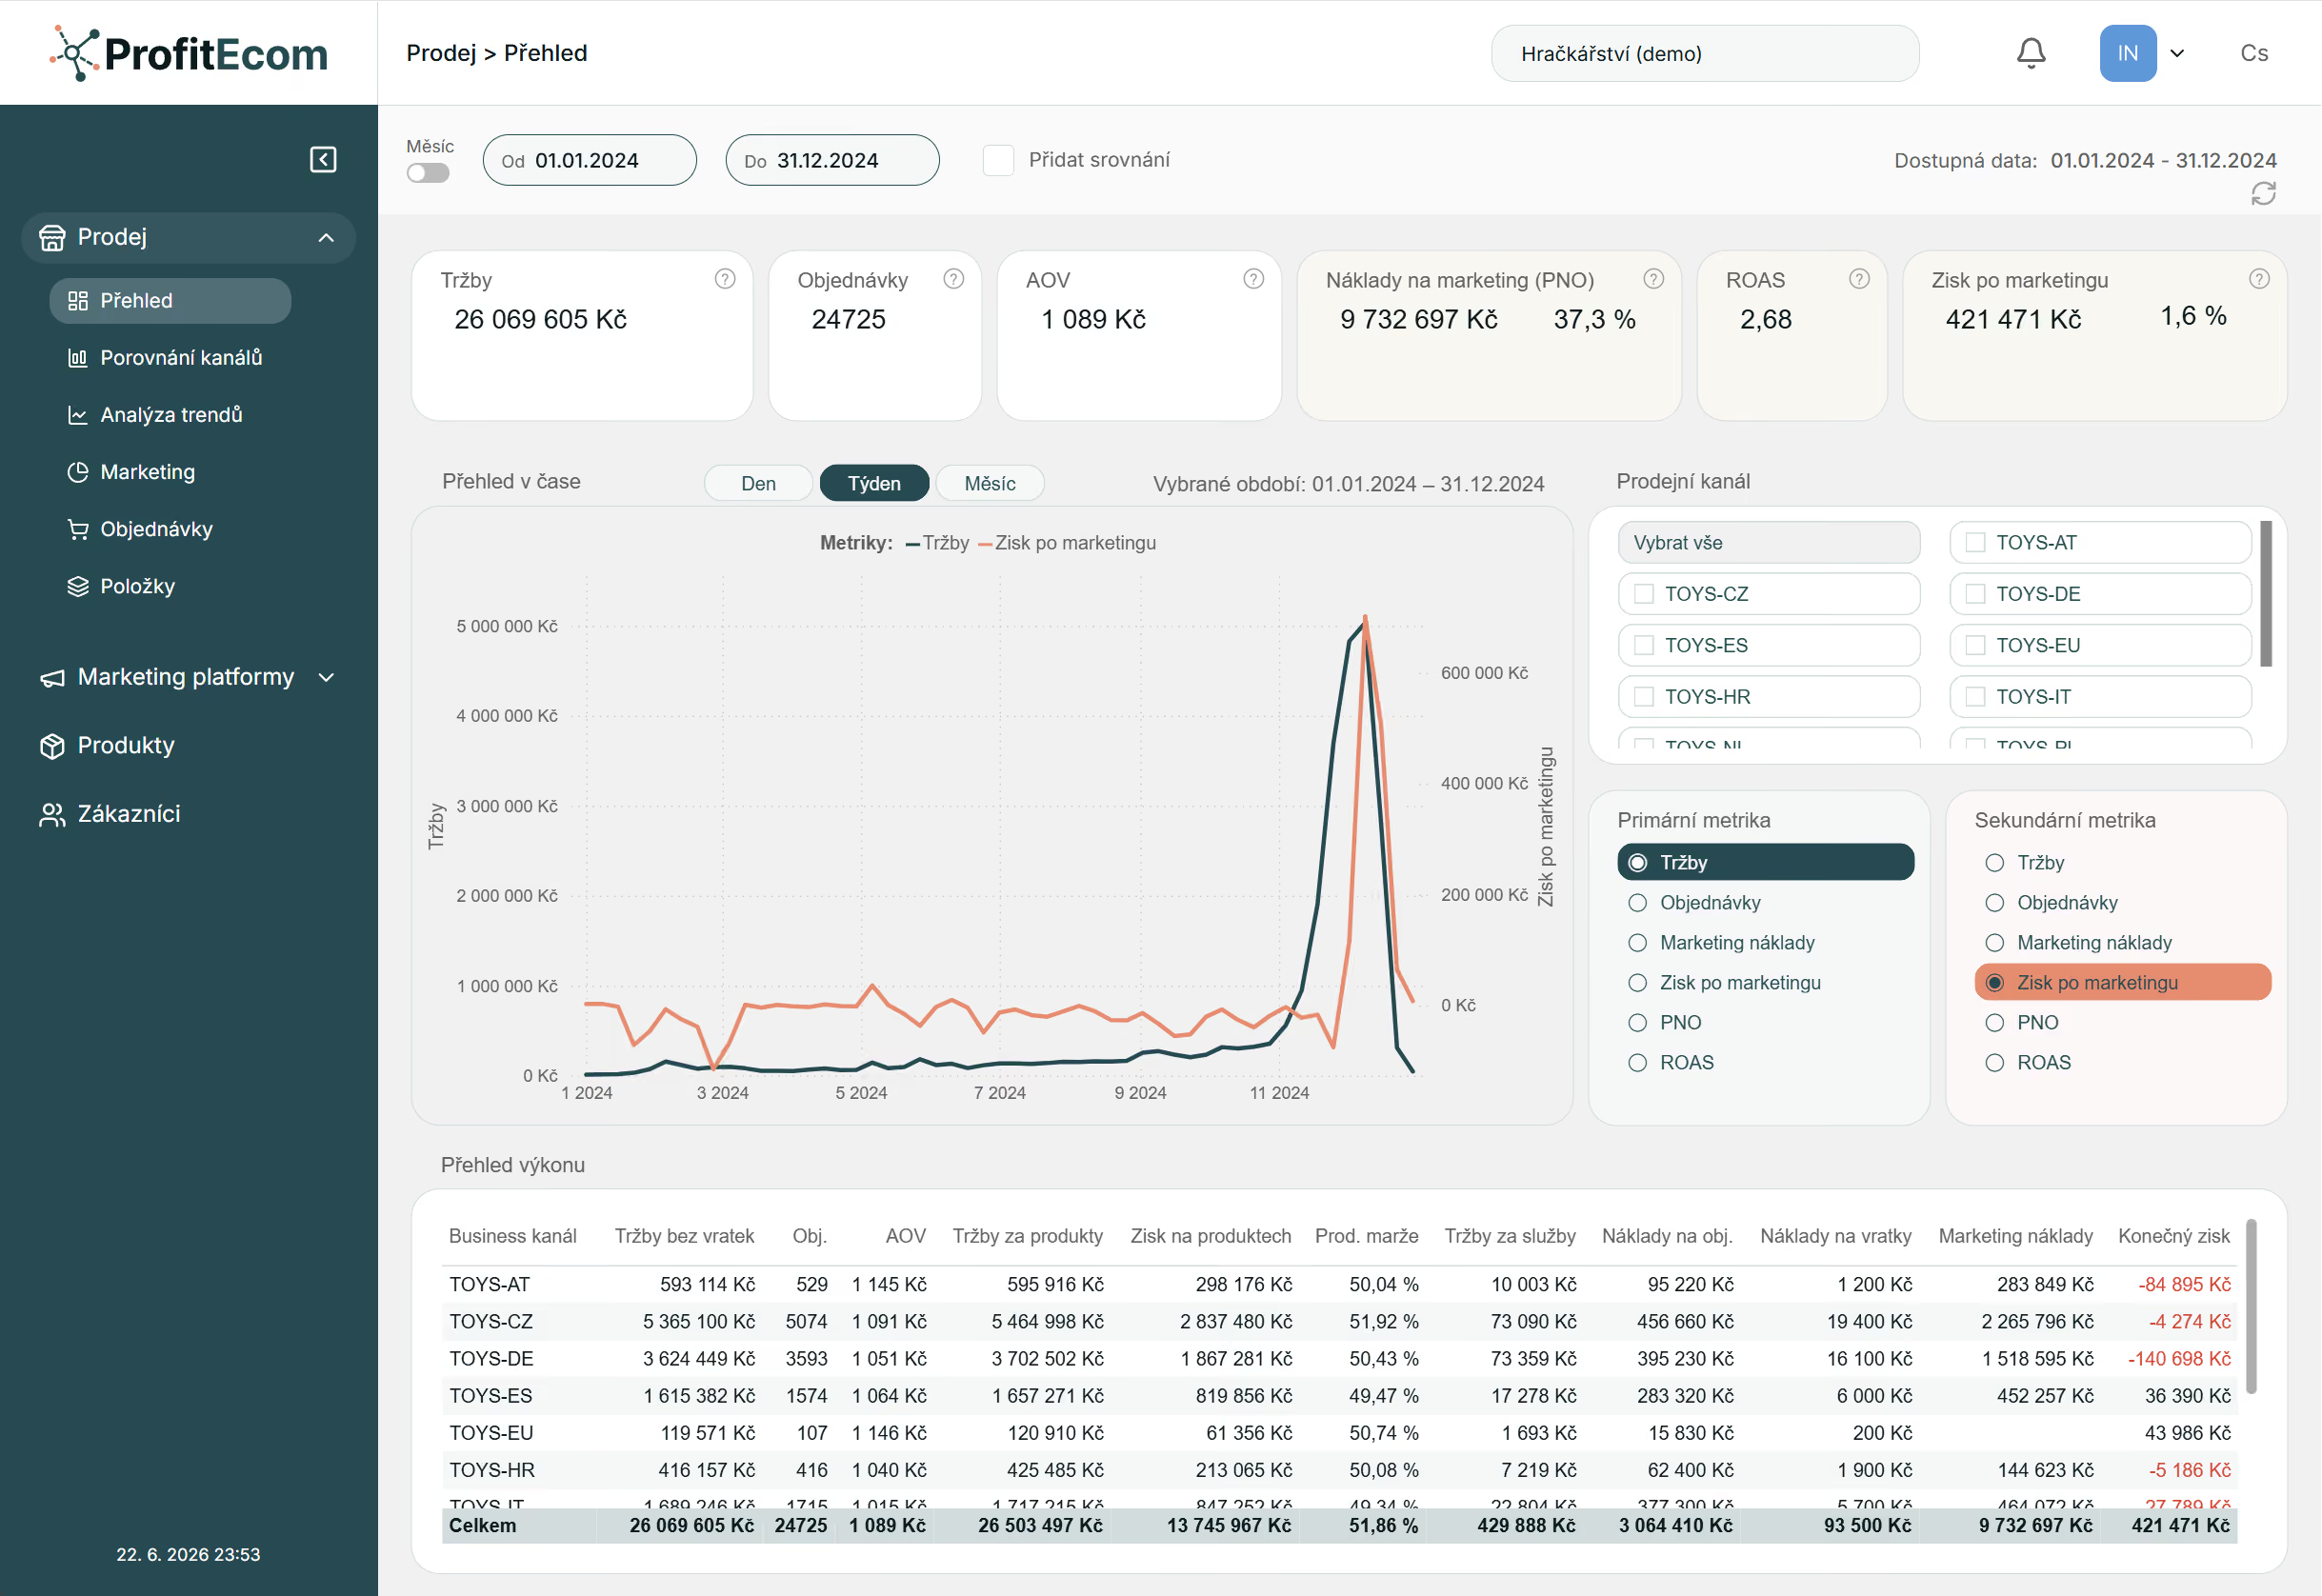
Revenue is growing. But is profit growing too?
Many online stores track revenue, orders, and campaign performance. But the actual bottom line is also affected by margins, returns, cancellations, discounts, and marketing costs.
ProfitEcom brings all this data together in a single view, making it clear what truly generates profit for your business.
- See more than just revenue.
- Identify weak spots.
- Make decisions using one consistent methodology.
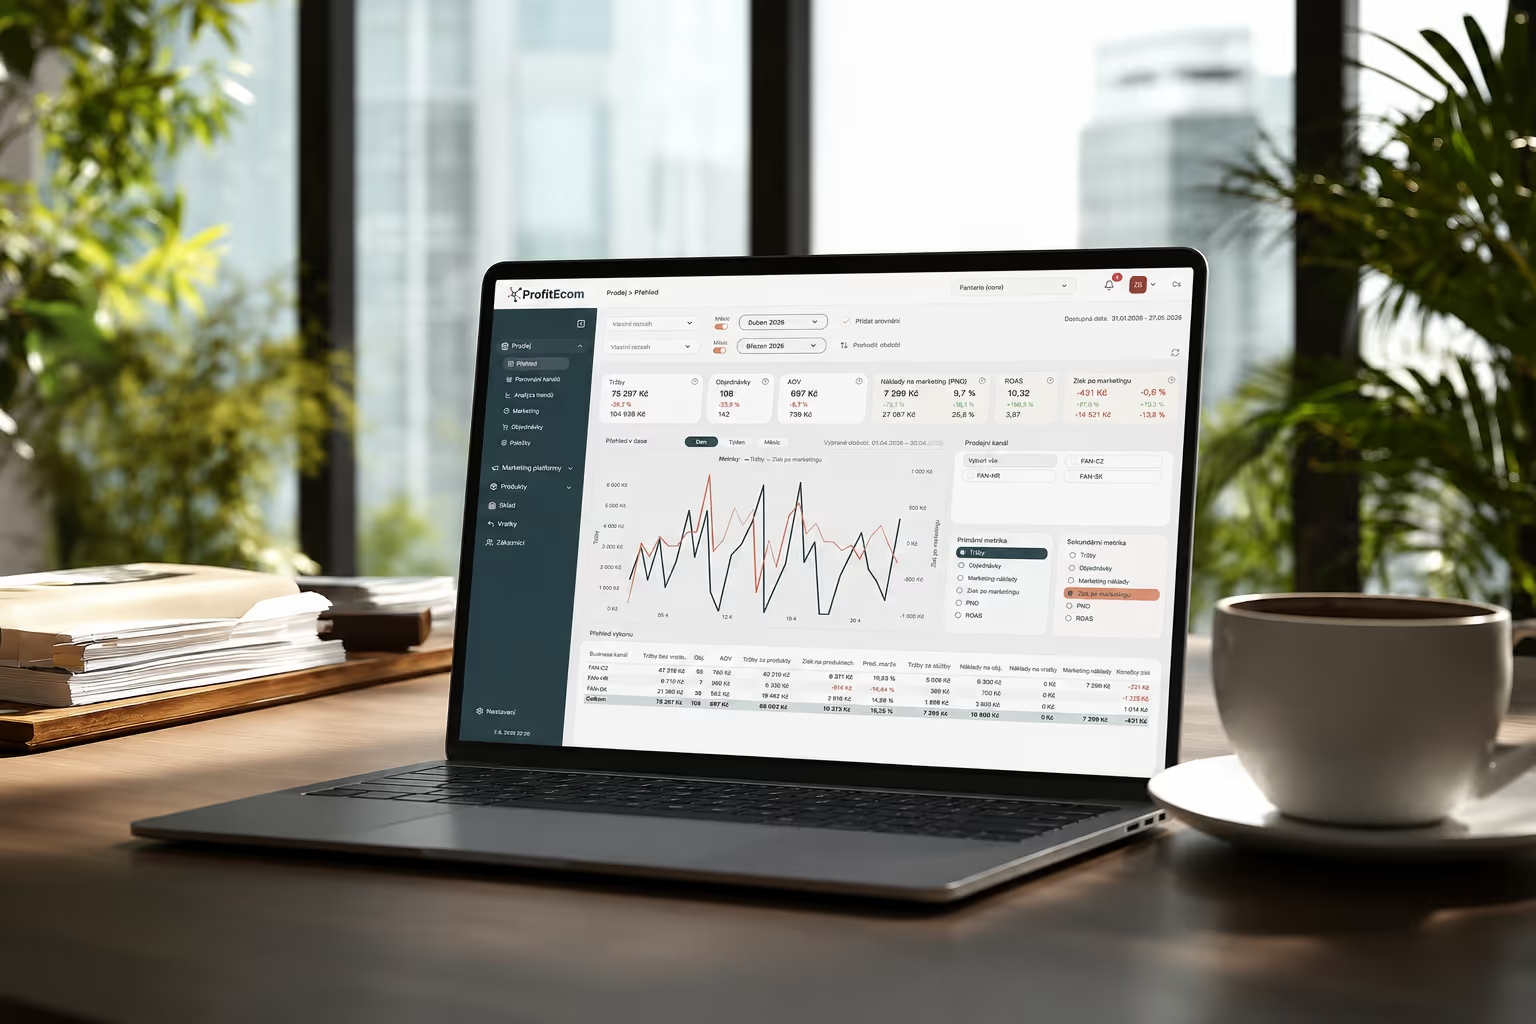
A report you can use to manage your e-shop.
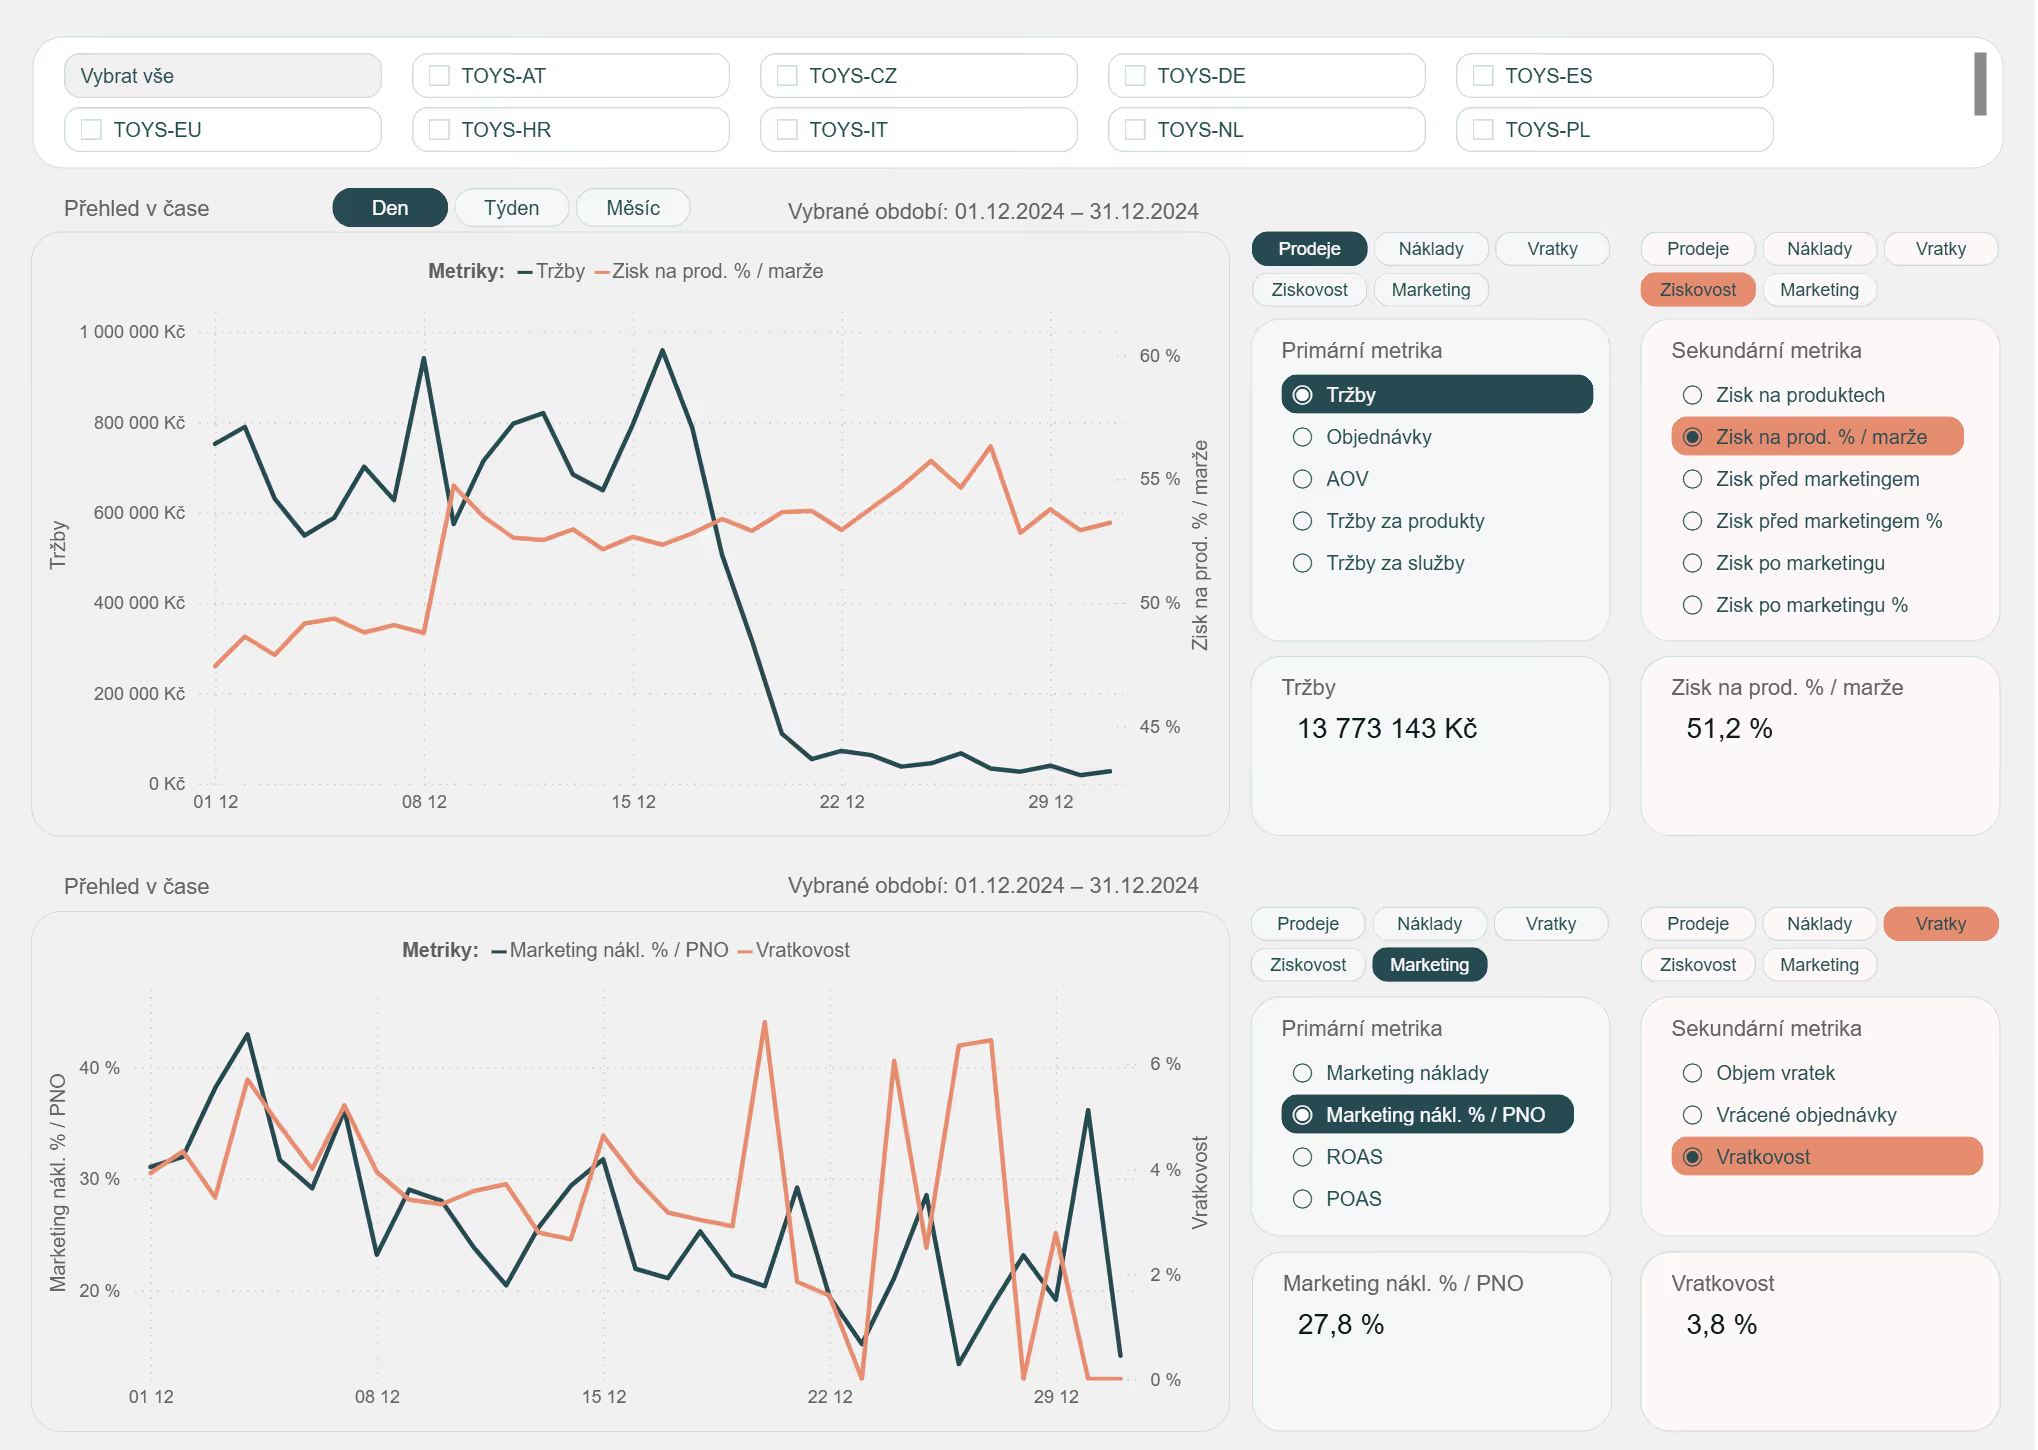
Overall e-shop performance
Revenue, orders, margins, marketing costs, and profit after marketing in a single overview.
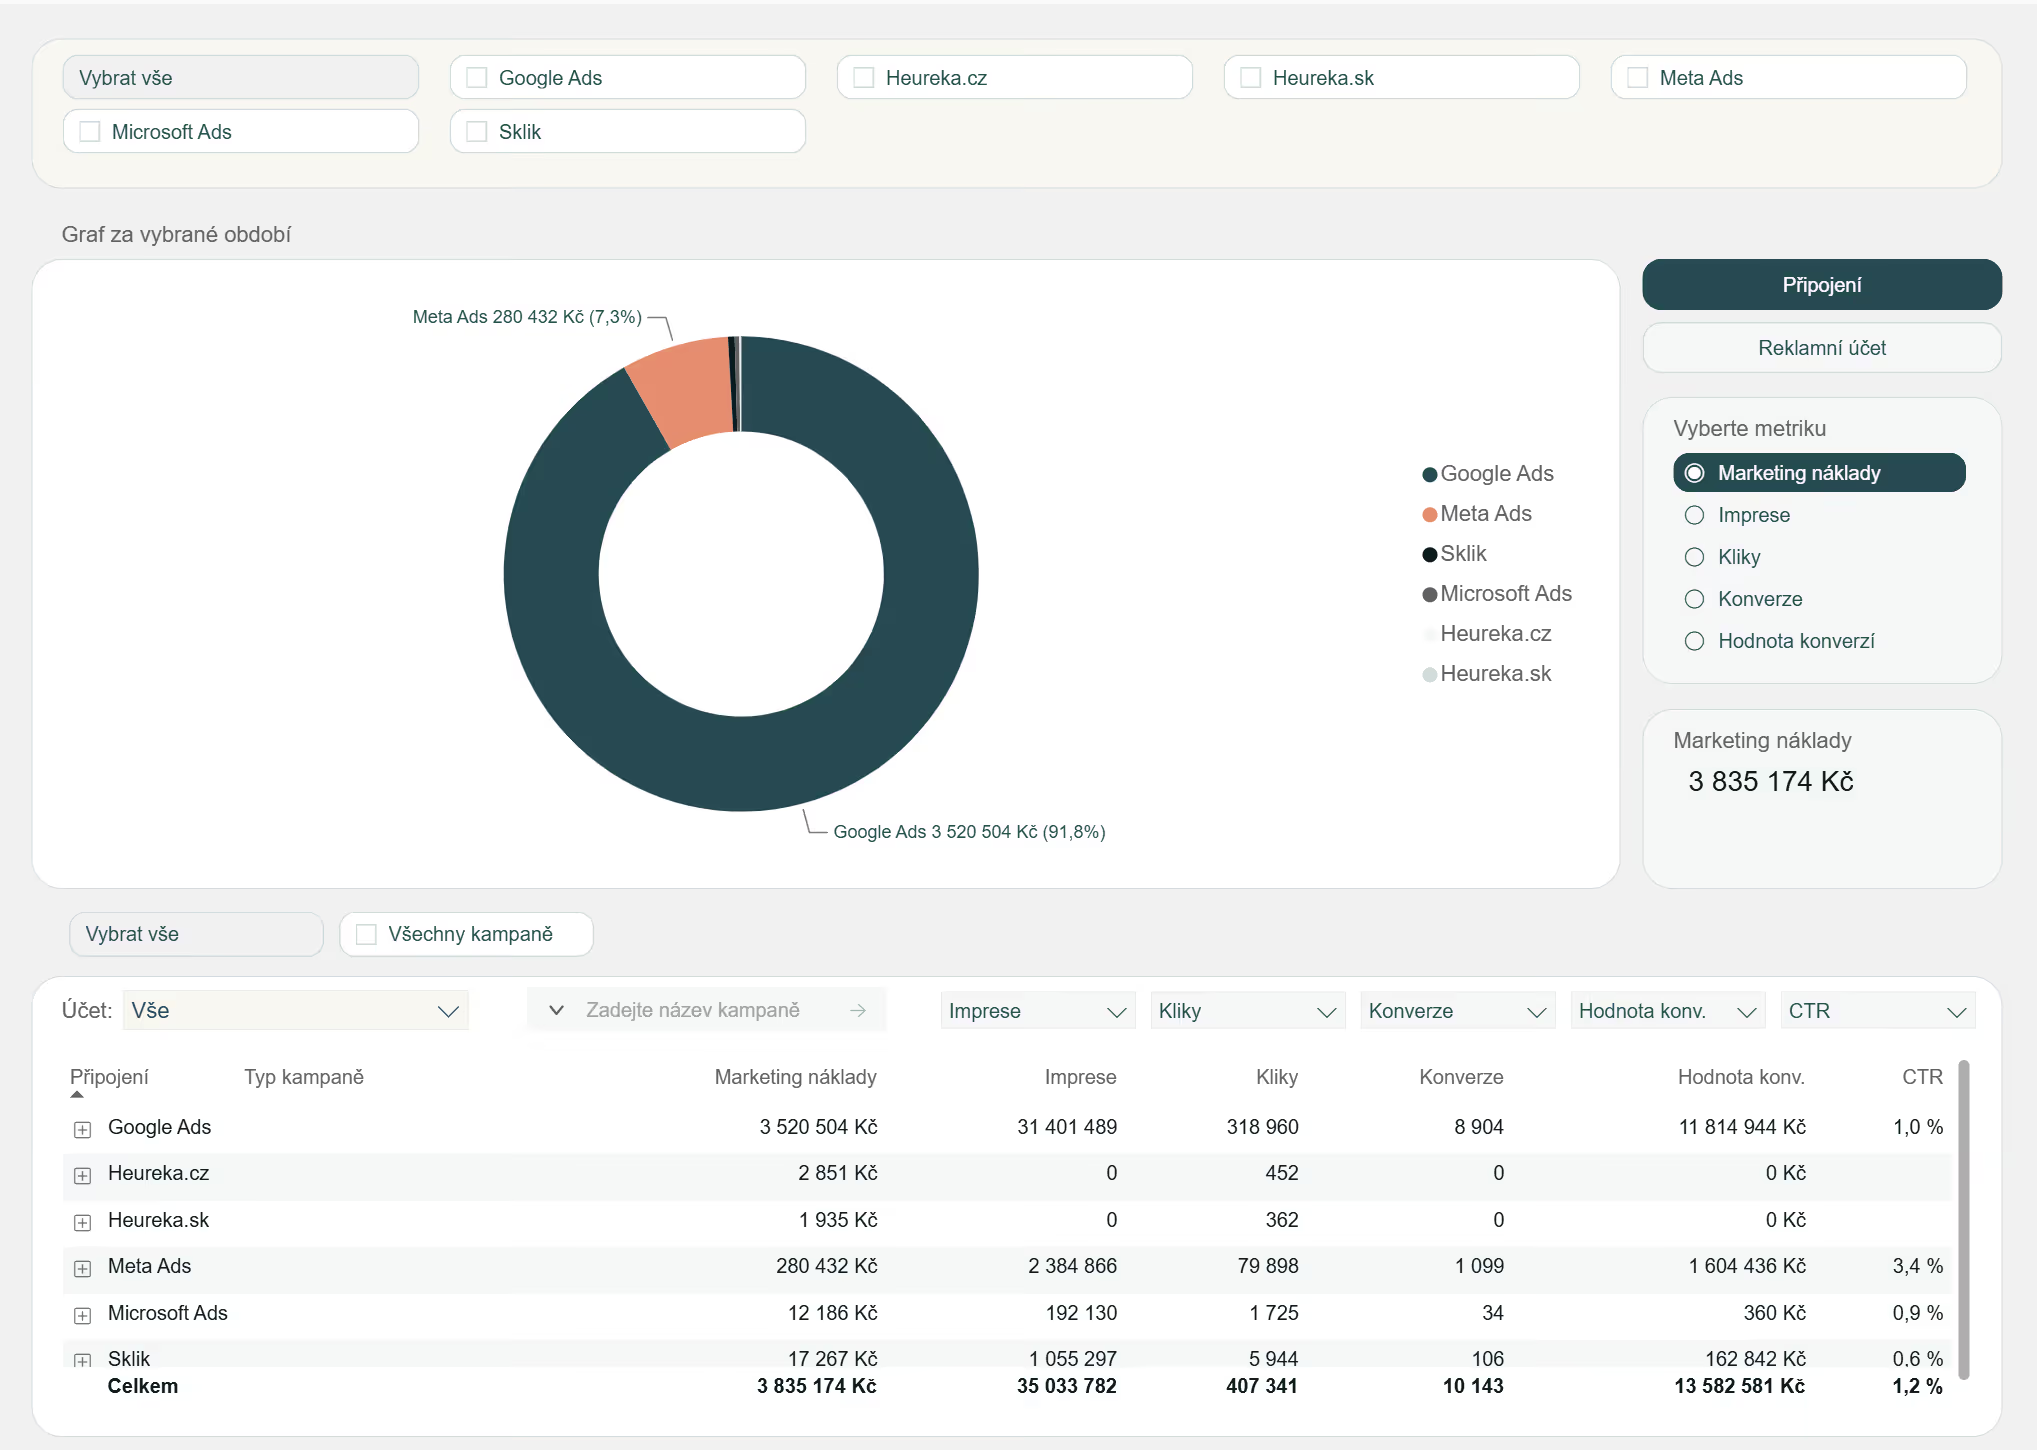
Marketing in context
You track marketing costs alongside your e-shop's actual results, not separately in advertising systems.
We combine data from various systems into a single view.
ProfitEcom works with data from e-shops, ERP systems, product catalogs, returns, and marketing platforms. The goal is not just to connect the data, but to properly unify and interpret it.


More than just a dashboard. A single source of truth for your e-shop's finances.
ProfitEcom helps standardize how revenue, margins, returns, cancellations, and marketing costs are calculated. This ensures that owners, management, finance, and marketing all work with the same figures.
- A single calculation methodology
- Data validation tailored to your business
- Insights for management and marketing
- Results you can trust

For e-commerce businesses that need more than just revenue tracking
Do you recognize any of these situations? Then ProfitEcom will help you gain a clear view of your e-shop's true profitability.

You're growing, but you don't know what's truly profitable
Revenue may grow, but profit can be lost in margins, returns, discounts, or marketing costs.
You're typically dealing with:
- Which products are truly profitable
- Where revenue isn't generating sufficient profit
- Why revenue is growing, but profit isn't

You're spending on marketing and you want to see the real impact
Advertising systems show campaign performance, but don't always show if the products sold are truly profitable.
You're typically dealing with:
- Whether marketing drives profit
- Which channels make economic sense
- How to connect marketing with e-shop results

You have data in different systems and you lack a unified view
Orders, products, margins, returns, and marketing are often in separate systems. ProfitEcom unifies them into a single methodology.
You're typically dealing with:
- Different reports show different numbers
- You manually compile data from multiple systems
- Management, finance, and marketing don't have the same view
What our clients say
ProfitEcom has consolidated data that we previously had to piece together from several different, and often inaccurate, sources. Now, we can quickly see our actual profit, not just our total revenue. We are gradually expanding the report with additional key insights that ProfitEcom customizes for us. It’s a fantastic system that lets me see exactly how we’re performing every single day.

From Initial Analysis to Profitability Overview
First, we identify your orders, products, margins, returns, and marketing costs. Then, we unify, verify, and display this data in a dashboard.
- We review available data.
- We establish a unified methodology.
- We verify that the numbers reflect reality.
- We provide dashboards for management, finance, and marketing.

Three Levels Based on What You Want to Manage
Each level works with a different data depth. The more data you connect, the closer you get to your e-shop's true profitability.

Marketing Overview
Ad platform costs and performance, all in one place. You also get detailed Google Analytics data in a clear format. Ideal for a quick start without ERP integration, meaning without exact financial data.
- Costs Across Ad Platforms
- Campaign Performance Over Time
- Marketing channel comparison


E-shop profitability management
The main level of ProfitEcom. It combines sales, margins, returns, and marketing costs so you can see the true performance of your e-shop. Requires integration with an ERP or other internal systems.
- Profit after marketing, real margin
- Products, categories, and channels
- A single methodology for both management and marketing

Profitability of ad campaigns
Advanced level with a website tracking script. It shows which ad platforms and campaigns were part of the pre-purchase journey.
- Measuring the pre-purchase journey
- Profitability of individual ad campaigns
- More precise profit-driven marketing management

1
Real-world application
2
Complex economics
3
A single overview
ProfitEcom was born from real e-commerce experience. We created a unified economic perspective on the true profitability of an e-shop.
Discover how ProfitEcom can help your business
Provide us with a few details and we'll get back to you with the next steps.