

When standard reports don't cover your company's specifics
ProfitEcom's standard reports cover the most common areas of e-commerce management. However, we also create custom reports for companies that are not involved in e-commerce at all – for example, for managing sales, orders, services, operations, or finance. Every company has its own processes, systems, and questions that a universal solution cannot answer.
Information often remains fragmented across CRM, ERP, accounting, marketing platforms, internal databases, and spreadsheets. Each system shows only a part of the reality. To make the right decision, however, you need to see the entire process and its actual result.
A custom report makes sense when:
- you regularly merge exports from several systems,
- you prepare management reports manually in Excel,
- different departments calculate the same metrics differently,
- you need to link activity to its business or financial outcome,
- your business model does not fit standard e-commerce reports,
- you only get important information after time-consuming research,
- standard reports show numbers but do not answer questions specific to your company.
Specific answers for specific parts of the company
Sales and Acquisition
Which leads actually convert into sales, and where do we lose them along the way?
We connect marketing sources, CRM, and the financial results of closed deals. You will see not only the number of leads acquired but also their quality and progress through the sales process.
For example, the report can show:
- number of leads and sales opportunities by source,
- conversion rates between individual stages of the sales process,
- time from lead acquisition to first response, proposal, or deal closure,
- value and probability of the current sales pipeline,
- performance of individual sales representatives or teams,
- reasons for lost sales opportunities,
- actual revenue or margin generated from individual sources,
- sales opportunities that require attention.
Orders, projects, and services
Which projects are profitable and where does the plan diverge from reality?
We connect sales, project, time, and financial data. You get an overview of individual project results before any issues impact the company's overall figures.
A report can track, for example:
- planned vs. actual revenue, costs, or hours worked,
- margin by project, client, team, or service type,
- budget utilization and cost overruns,
- progress and deadlines of ongoing projects,
- workload of individuals or teams,
- time from order to completion and invoicing,
- repeat business and the long-term value of individual clients.
Operations and Capacity
Where do delays, unused capacities, or unnecessary costs arise?
We connect data from warehouse, production, logistics, service, and other operational systems. The report shows the process flow from start to finish.
For example, you can track:
- volume of work-in-progress requests or orders,
- lead times for individual parts of the process,
- workload of departments, branches, or teams,
- adherence to deadlines and agreed service levels,
- bottlenecks where work most frequently stalls,
- complaints, errors, or repeat interventions,
- performance and capacity trends over time,
- differences between planned and actual progress.
Finance and Management
How do actual results differ from the plan, and where are the variances coming from?
We connect your accounting or ERP data with budgets, projects, departments, and other operational information. You get a unified view of the entire company without having to manually compile multiple reports.
Reports can include, for example:
- planned vs. actual results by period,
- revenue, costs, and profitability by department,
- performance of branches, teams, or companies,
- breakdown of major budget variances,
- trends in payables, receivables, or cash flow,
- expected results based on your current sales pipeline,
- key performance indicators specific to your business.
One reliable source for daily decision-making
During the day, orders, business cases, invoices, or other records may still be in progress. Furthermore, individual systems update their data at different times.
ProfitEcom therefore works with complete data from the previous day. Overnight, we load, connect, recalculate, and automatically check data from all integrated systems for technical errors.
Every morning, you get an up-to-date and consistent overview where:
- data from all integrated systems is included,
- all necessary calculations are complete,
- the same rules apply to all parts of the report,
- you don't have to wait for manual exports and spreadsheet adjustments,
- management and individual teams work from the same numbers.

What our clients say
ProfitEcom has consolidated data that we previously had to piece together from several different, and often inaccurate, sources. Now, we can quickly see our actual profit, not just our total revenue. We are gradually expanding the report with additional key insights that ProfitEcom customizes for us. It’s a fantastic system that lets me see exactly how we’re performing every single day.

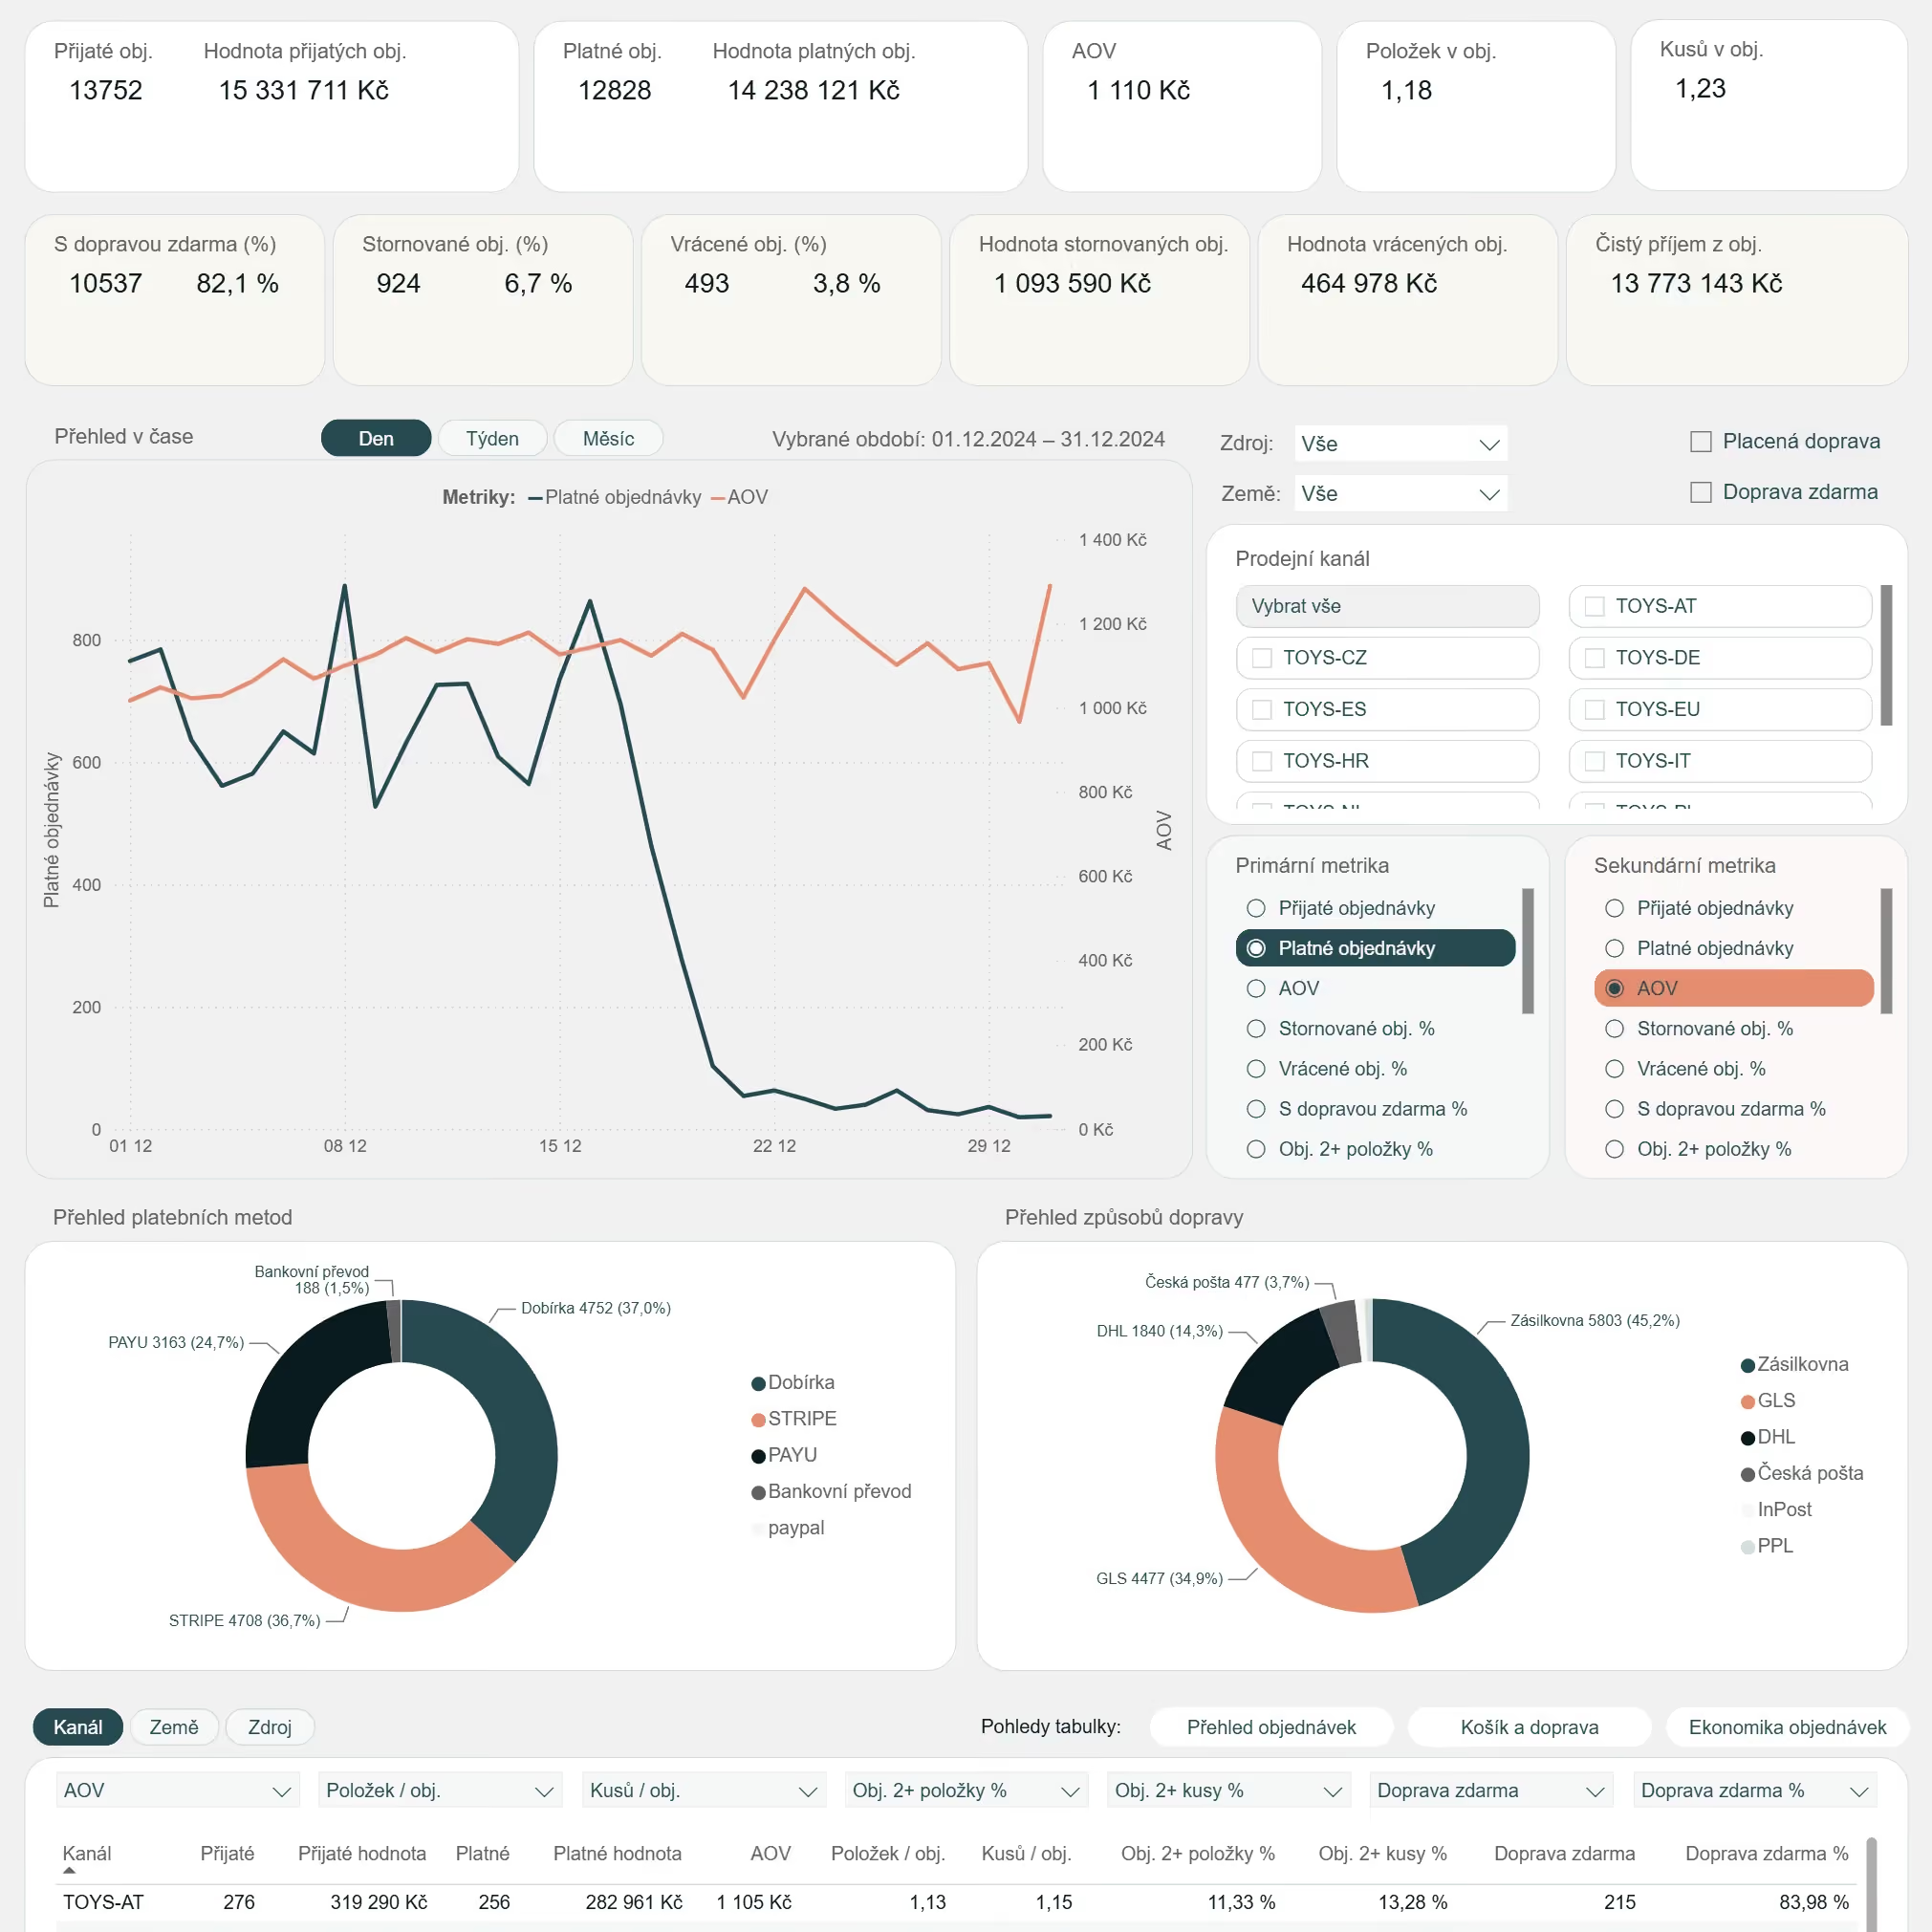
We connect your systems to create a unified view
You can keep using your CRM for sales management, your ERP for invoicing and accounting, your project management system for tracking orders, and your marketing platforms for campaigns.
ProfitEcom does not replace these tools. It connects their data and creates a shared analytical layer on top of them.
Users continue working in the systems they already know, while management gains a single overview for company-wide decision-making.
We build logic that your company can trust
- connecting the necessary systems and data sources
- standardizing names, statuses, code lists, and identifiers
- linking records that appear differently across various systems
- defining KPIs and their calculation methods
- automated data processing and validation
- creating a clear and intuitive report
- setting up access permissions for individual users
- documentation of key calculations and rules
- gradual expansion based on the company's evolving needs
The result is a single, unified view that both management and individual teams can rely on for decision-making.
From question to actionable report
We will define the questions you need answered
We will review how you currently manage the area, what decisions you make, and what information you are missing.
We don't start with a list of charts. First, we need to understand what the report is intended to change or improve.
We will audit available data
We will identify which systems contain the necessary information, how it can be retrieved, and how it can be accurately linked.
At the same time, we will verify data quality and highlight any potential limitations before implementation begins.
We will design the solution and calculation methodology
We will define the content of the first report version, the data sources to be used, key performance indicators, and the rules for their calculation.
Before we even start, you will know exactly what the solution includes, how it will work, and what its scope will be.
We connect your data and build the report
We will set up automated data processing, analytical logic, and the report itself.
We continuously verify the results using real-world examples from your company.
We will fine-tune the report together
We will review the first version with the people who will actually be using it. We will refine the report to ensure it is clear and helpful for day-to-day decision-making.
We can gradually expand the finished solution with additional systems, metrics, or business areas.
The answers are in your data
Get clear numbers to manage your business. We will look at the data you already have, what can be integrated, and how a custom report could specifically help your company.